The trade journal, and what its breakdowns reveal
Hex37 logs every trade automatically. Here is how to use the journal and breakdowns to find your patterns.
6 min read
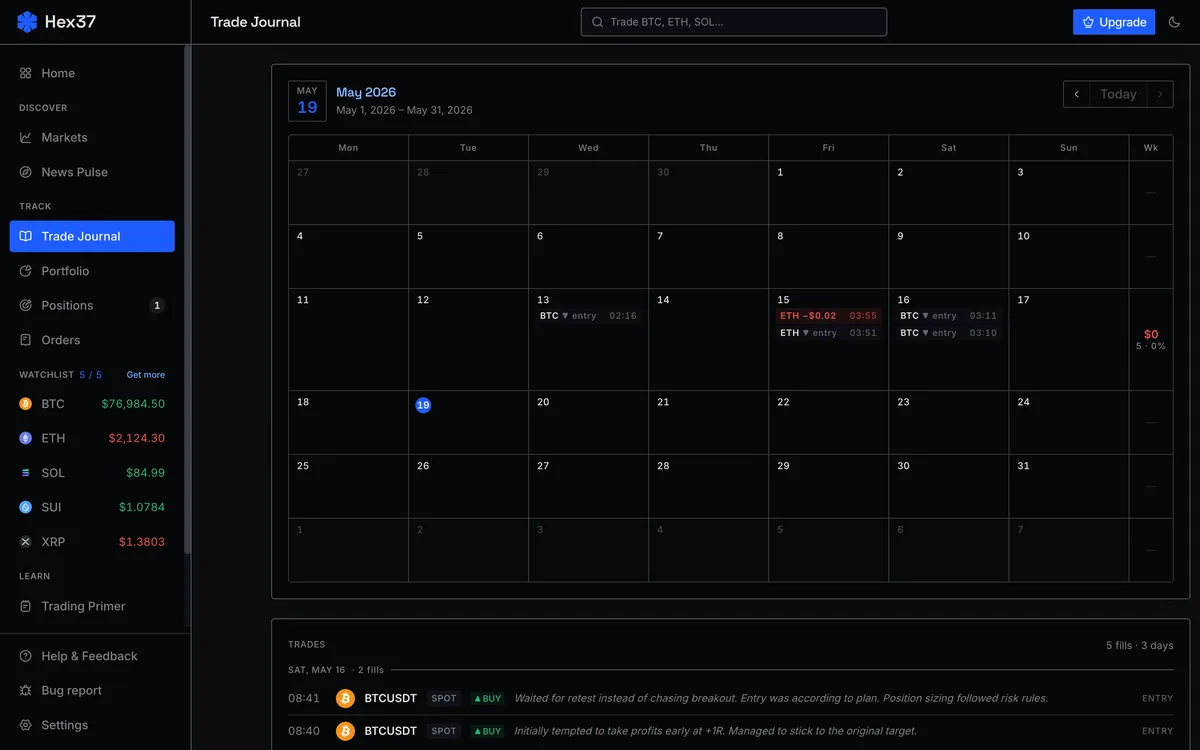
The journal at /app/journal logs every trade automatically with full context: entry, exit, R-multiple, fees, fill type, regime tags. It also computes breakdowns by asset, day, hour, and session.
What the journal captures automatically
- Date, time, asset, direction
- Entry, stop, exit; R-multiple at exit
- Position size, risk in dollars and percent
- Fees, maker vs taker, slippage
What you should add yourself
One or two sentences per trade: what was the setup, did you follow the plan, any behavioral observation (FOMO, hesitation, revenge)?
The breakdowns
By instrument, by day-of-week, by hour, by session. Most traders find they make money on one or two pairs and lose on the rest, or consistently lose at specific hours. The data shows it; intuition usually misses it.
The weekly review
- Glance at R distribution.
- Count plan-adherent vs improvised trades.
- Check breakdowns for surprises.
- Read behavioral notes for patterns.
Write down one specific thing you will adjust next week. Small consistent changes compound.
Frequently asked questions
What is an R-multiple?
R is the dollar amount you risked on a trade (entry minus stop, multiplied by size). R-multiple normalizes outcomes — a +2R win means you made twice your planned risk.
Do I need to add notes manually?
Trade data is logged automatically. Notes are optional but high-value — behavioral observations are the patterns the data alone cannot show.