The trading workspace, explained
A walkthrough of every panel on the trading workspace and what each one is for.
6 min read
The trading workspace is where every active trade gets placed, monitored, and closed. Open it from Trade in the top nav and pick any instrument. Here is what each region does.
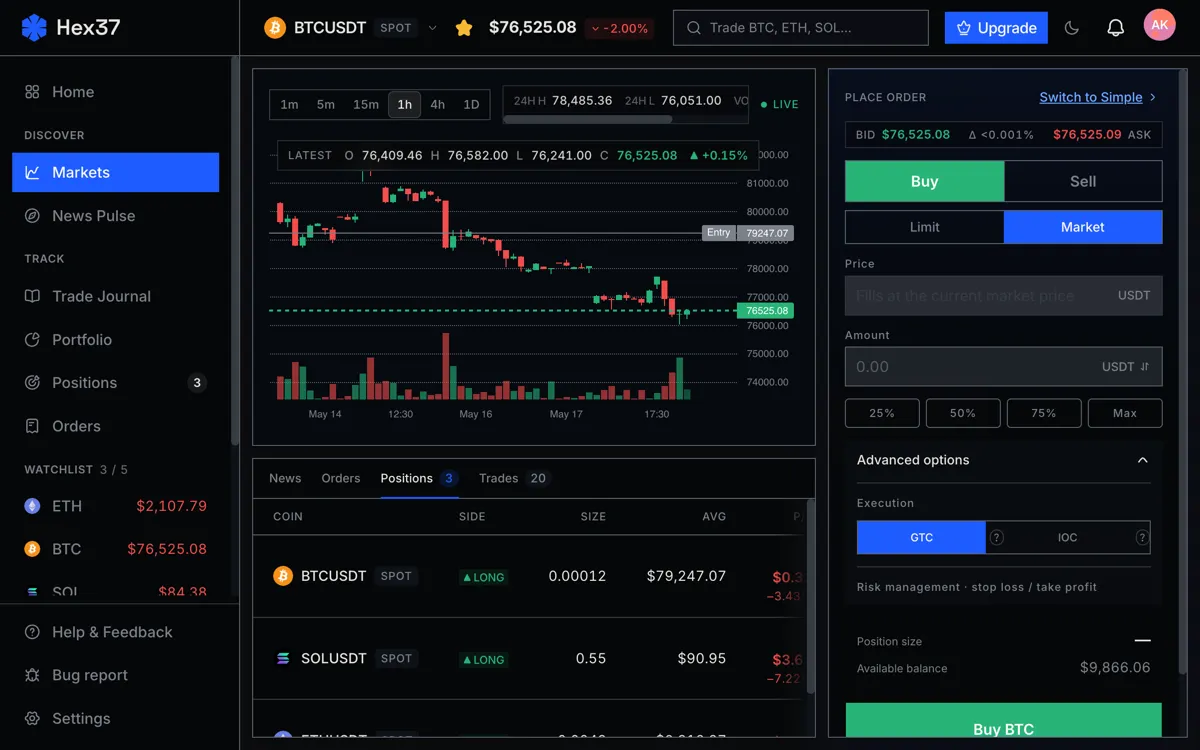
The instrument header
Top of the page. Shows symbol, last trade price, 24-hour change, and live spread. A tight spread means liquidity is healthy. A wide spread is a warning that liquidity has thinned, often around news.
The chart
Candlestick chart with a timeframe switcher (1m, 5m, 15m, 1h, 4h, 1d). Volume bars sit below each candle. Touch crosshair on mobile, hover on desktop.
The order book and depth
Below the chart on desktop, in a sub-tab on mobile. A useful pre-trade habit: glance at depth and estimate how much your intended order will consume. If you would eat through 5+ levels, size down or use a limit order.
The order form
- Side and type at the top.
- Position sizer in the middle — enter risk percent and stop distance, get quantity computed for you.
- Leverage slider for perpetuals. Liquidation price updates live next to your stop.
- Bracket order toggle — recommended on. Adds child stop-loss and take-profit that activate on the entry fill.
- Advanced flags in a disclosure: post-only, reduce-only, isolated vs cross, mark vs last for stop triggers.
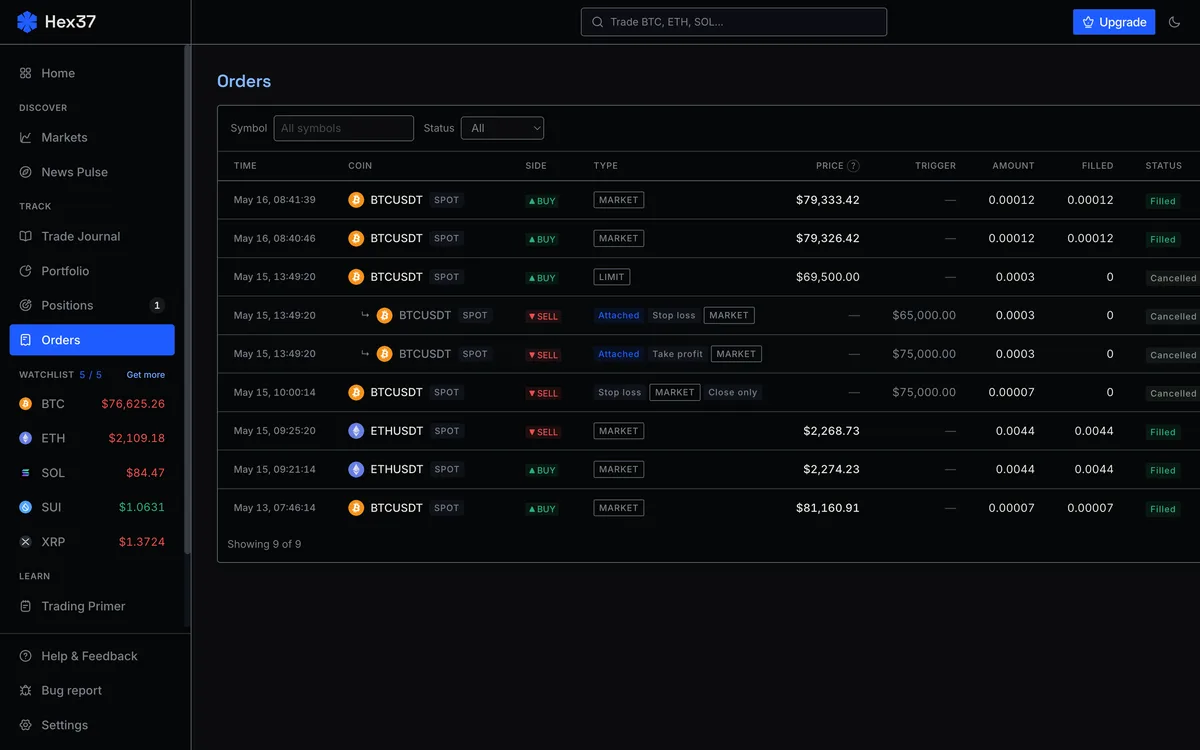
The bottom rail
- Orders — active and recent. Cancel, modify, close.
- Positions — open positions with live PnL, liquidation price, accumulated funding.
- Trades — every fill with maker / taker tag.
Where to learn more
Frequently asked questions
Can I customize the workspace layout?
Layout is currently fixed: chart, order form, bottom rail on desktop; single-column with sticky CTA on mobile. Customization is on the roadmap.
Why does the chart show last price instead of mid?
Last price reflects the most recent actual trade and is what most traders intuitively read. Mid is shown next to the spread in the instrument header for explicit reference.